Get a Consultation
Fill out the form, and we'll get in touch with you to discuss all the details!
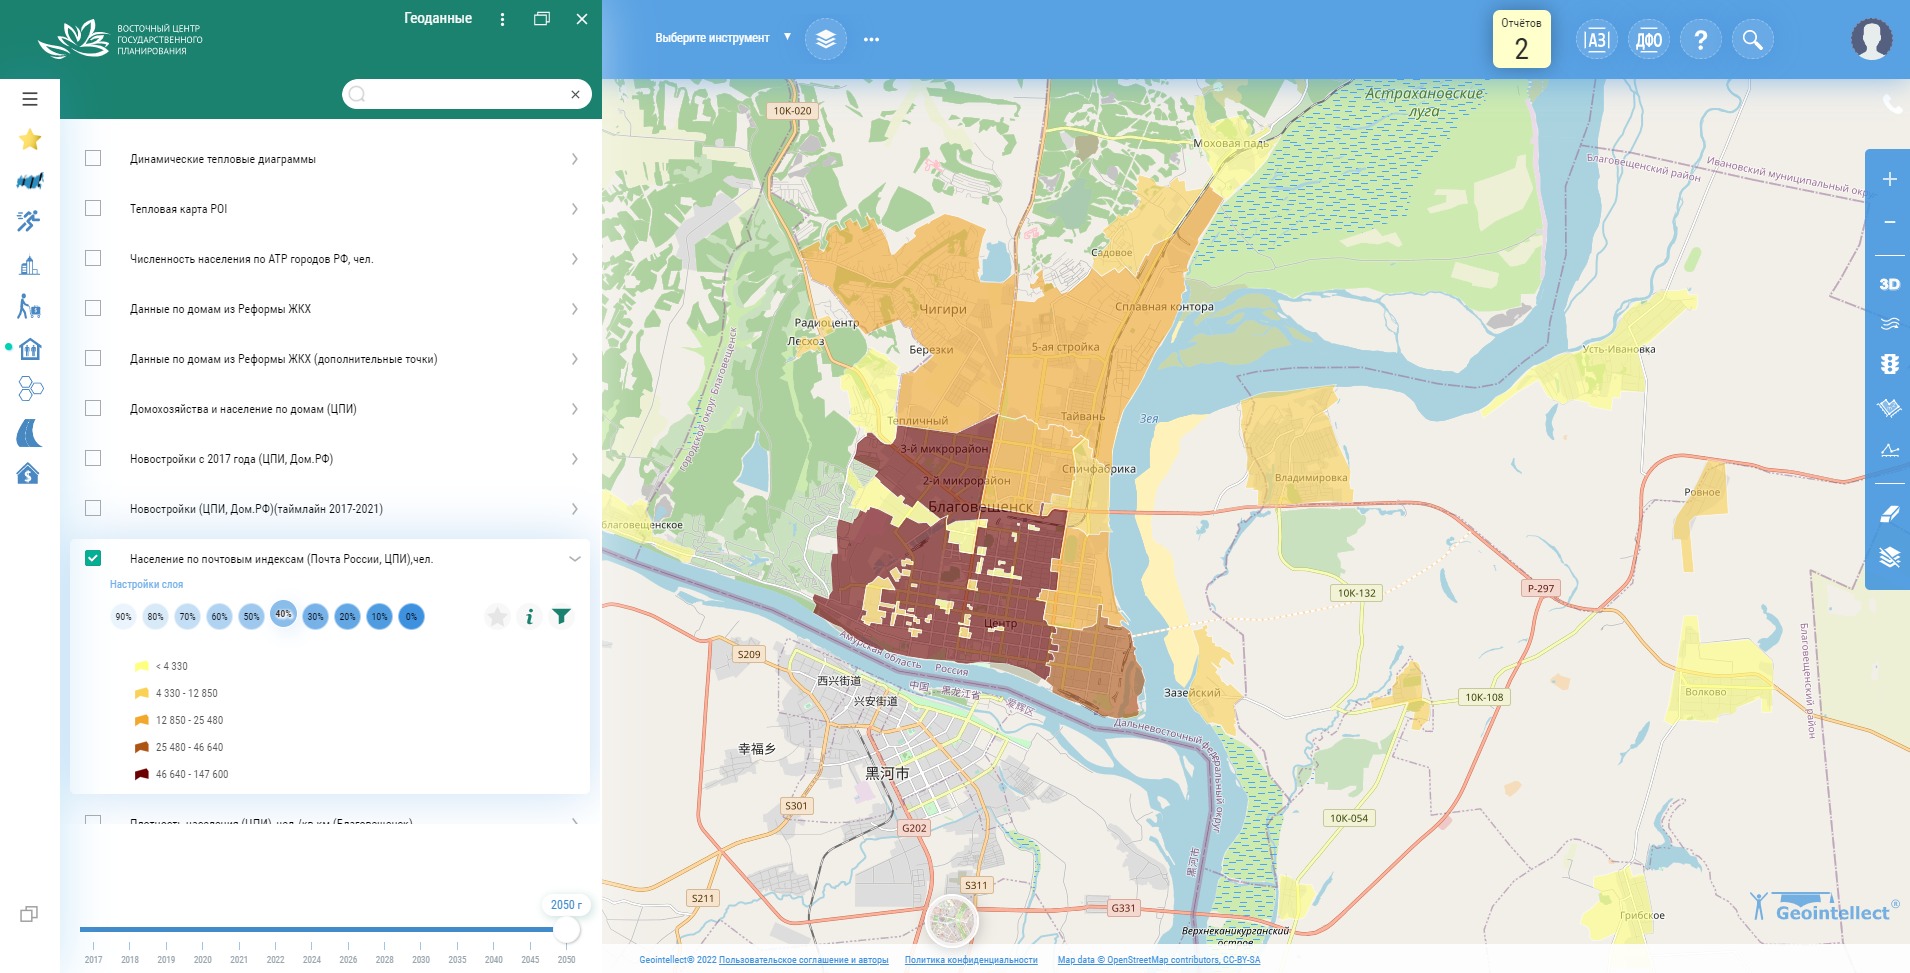
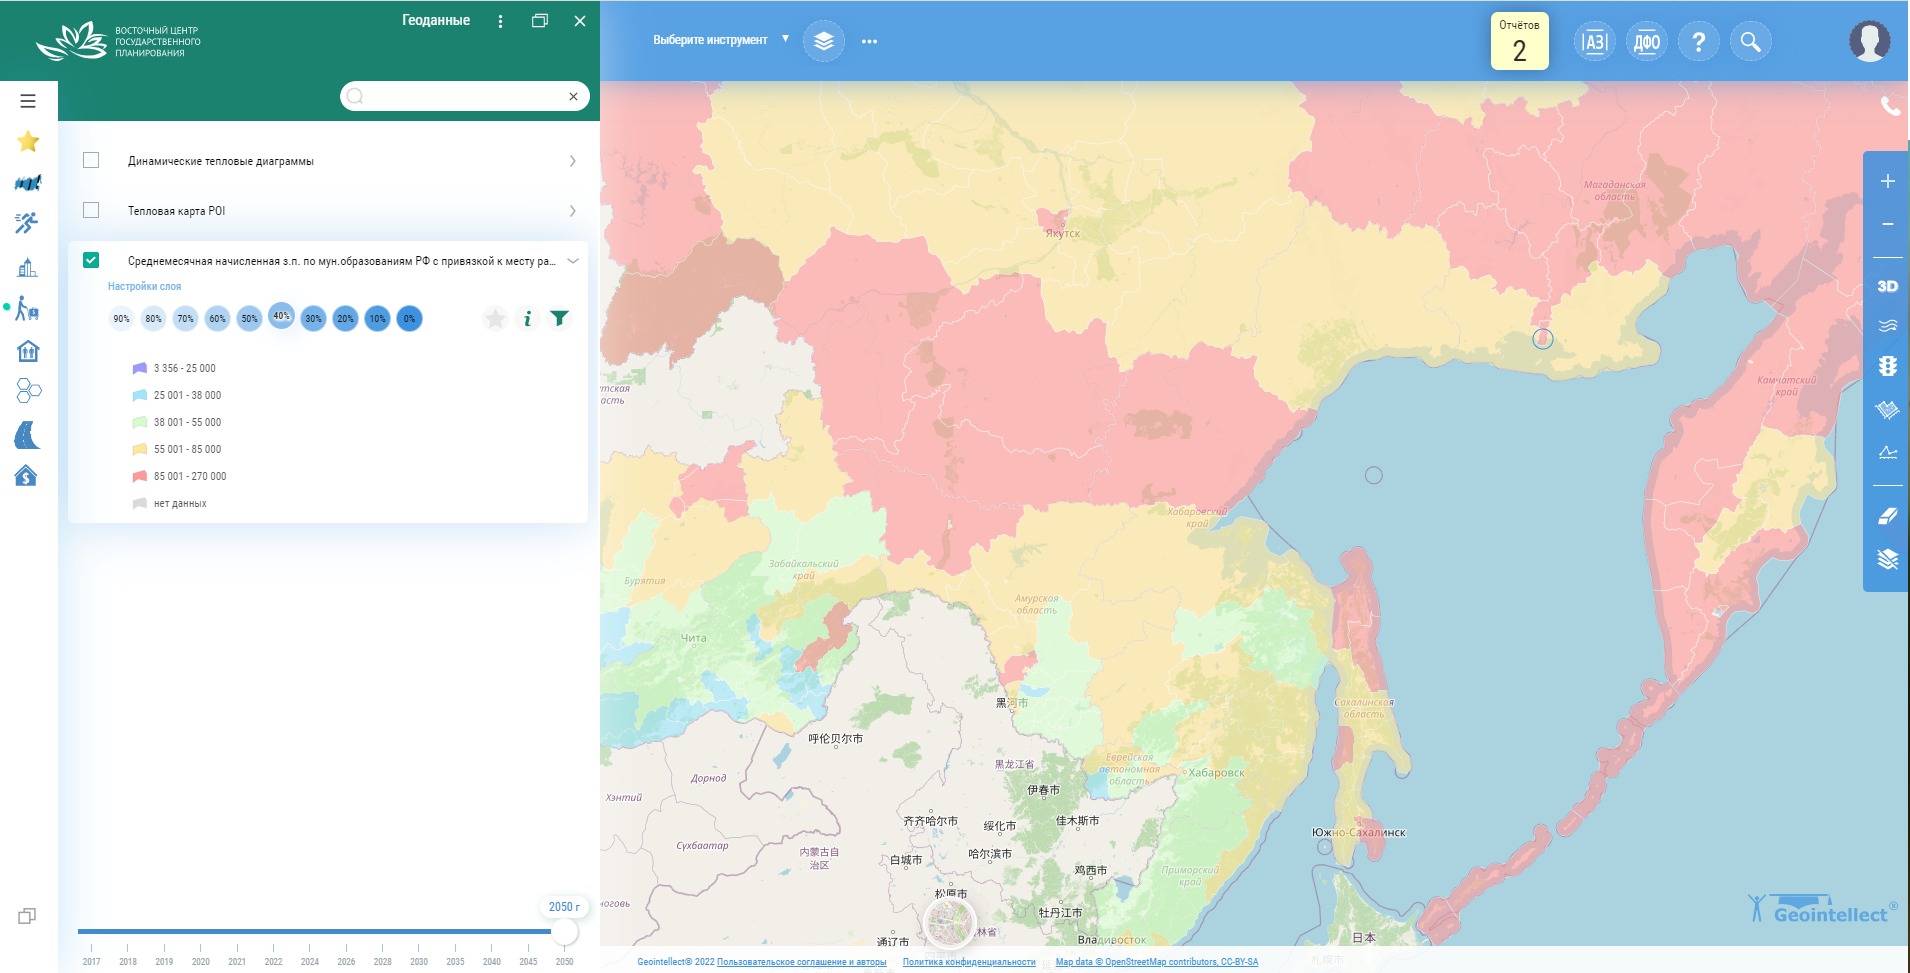
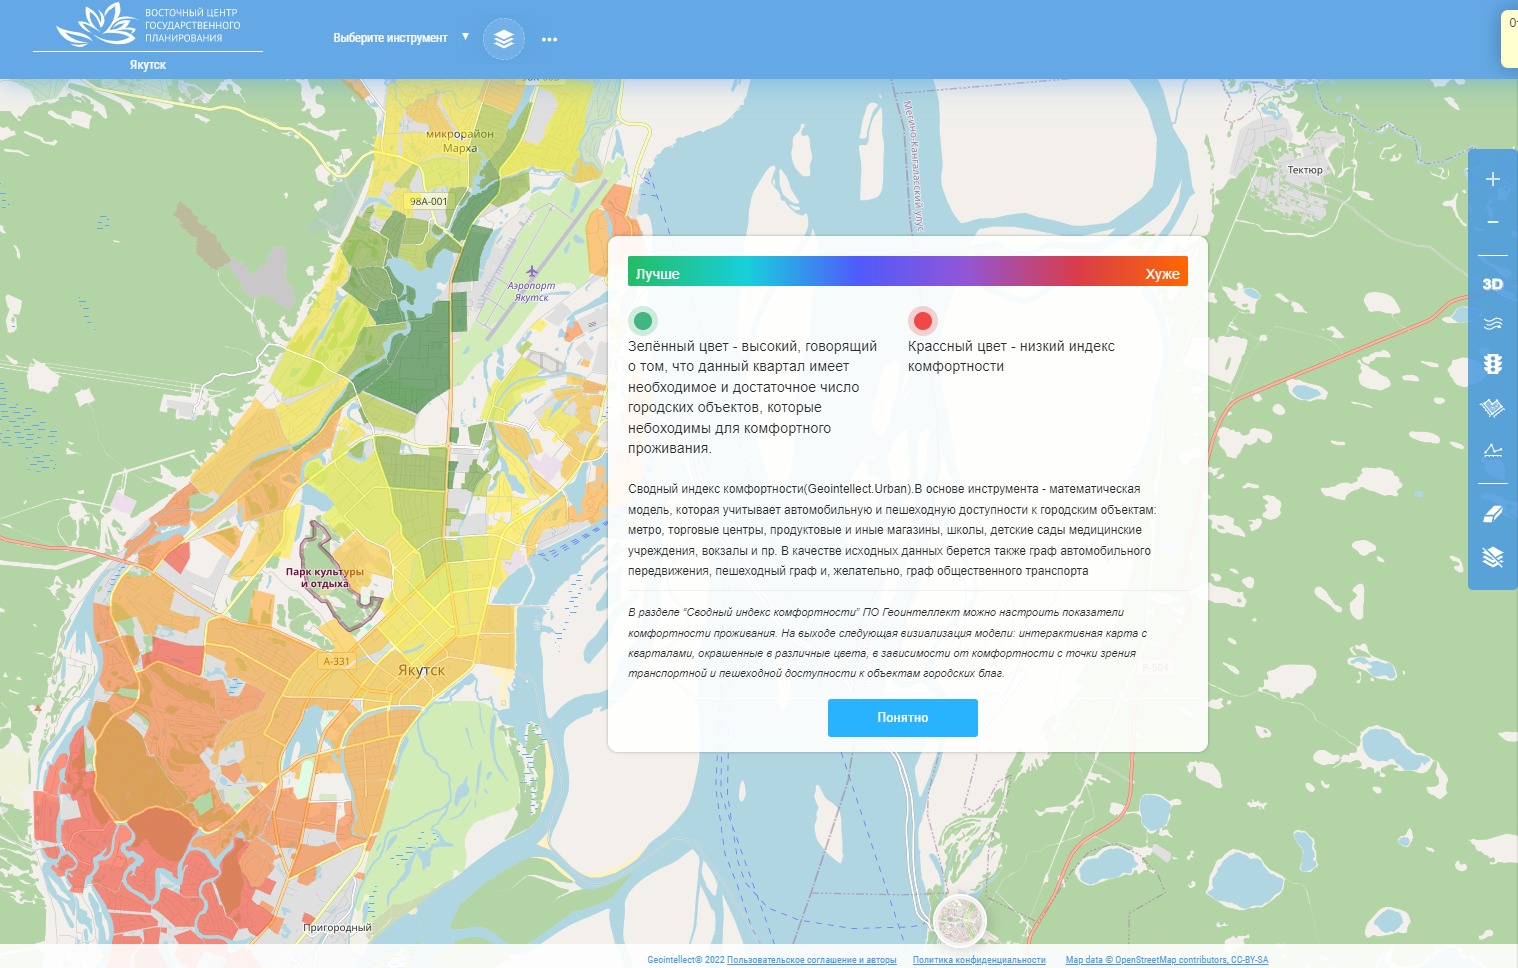
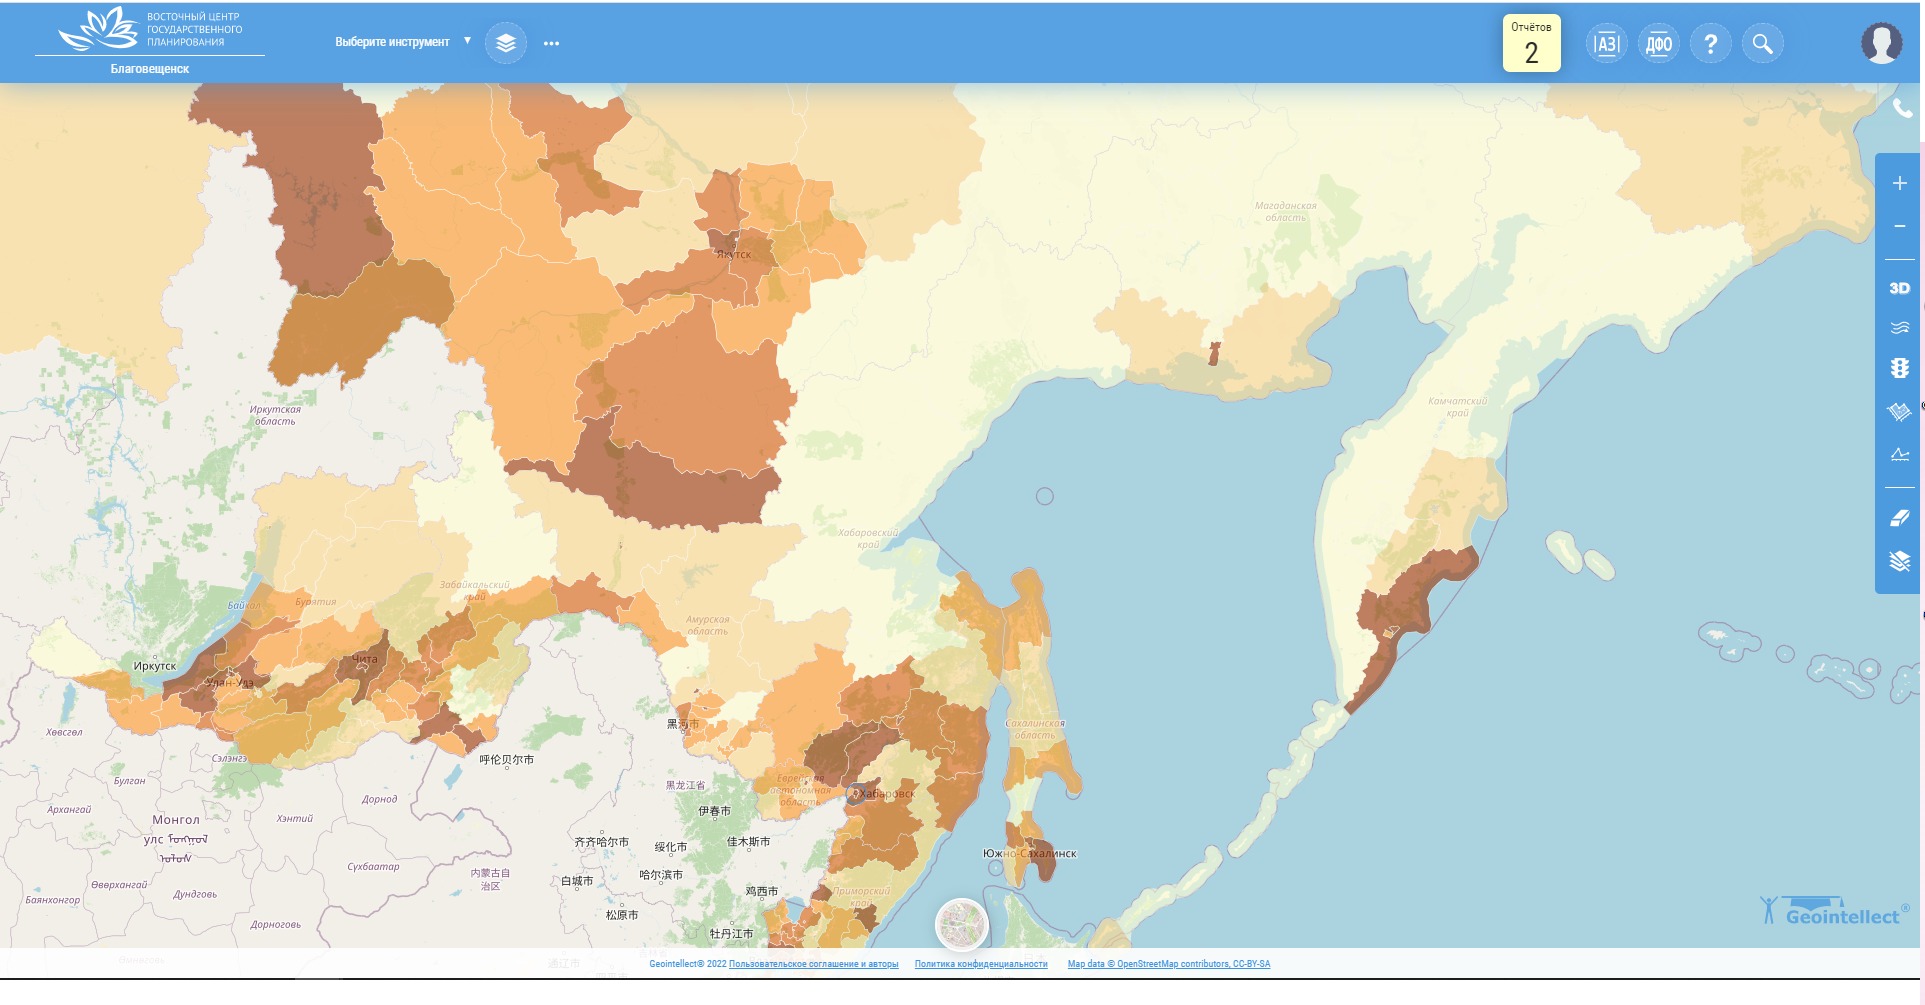
ВГП-Геоинтеллект – система сбора, хранения, анализа и графической визуализации пространственных данных и связанной с ними информацией о необходимых объектах.
A platform for geoanalytics with the ability to build heatmaps, display multiple layers, and generate customizable reports in a convenient format based on the specific needs of the user.

Сервис входит в Цифровой конструктор ФАНУ “Востокгосплан”. Для получения демо-доступа небоходимо fill out the form at the link.
На основе платформы ВГП-Геоинтеллект ФАНУ «Востокгосплан» реализованы следующие проекты:
Для решения задач гео-привязанной аналитики в ВГП-Геоинтеллект загружен обширный массив гео-привязанных данных по Дальнему Востоку и Арктической зоне Российской Федерации, который можно анализировать с использованием встроенных в платформу инструментов. Для выгрузки результатов доступны распространенные форматы PPTX, DOCX, XLSX, CSV.
Fill out the form, and we'll get in touch with you to discuss all the details!
We will contact you!